Prime cost is what you spend on labor and food. Insights → Prime Cost puts both next to your sales, day by day, and shows the share of sales each one takes.
Who: admins. Anyone else needs a custom role with the View insights permission, and then sees only the locations they work at. See Roles and permissions. Insights is part of every plan, on the web app only.
What it needs:
- Sales from a connected POS: Square or Union POS.
- Labor from the time clock: finished punches, and a wage on each person or position. See Positions and wages.
- Food cost from inventory: the items you sell mapped to recipes, and a cost on each ingredient. See POS mapping and automatic depletion. Inventory is part of the Pro plan.
Open Prime Cost
- Go to Insights → Prime Cost.
- Click the date button to change the dates. The page starts on the last 14 days, today included. Pick Last 7 days, Last 14 days, Last 30 days, This month or Last month. Or set From and To and click Apply.
- Choose Day, Week or Month for the columns.
- Under Filter data → Branches, tick the locations you want. The page opens on the location picked at the bottom of the sidebar. Tick Select all to see every location together.
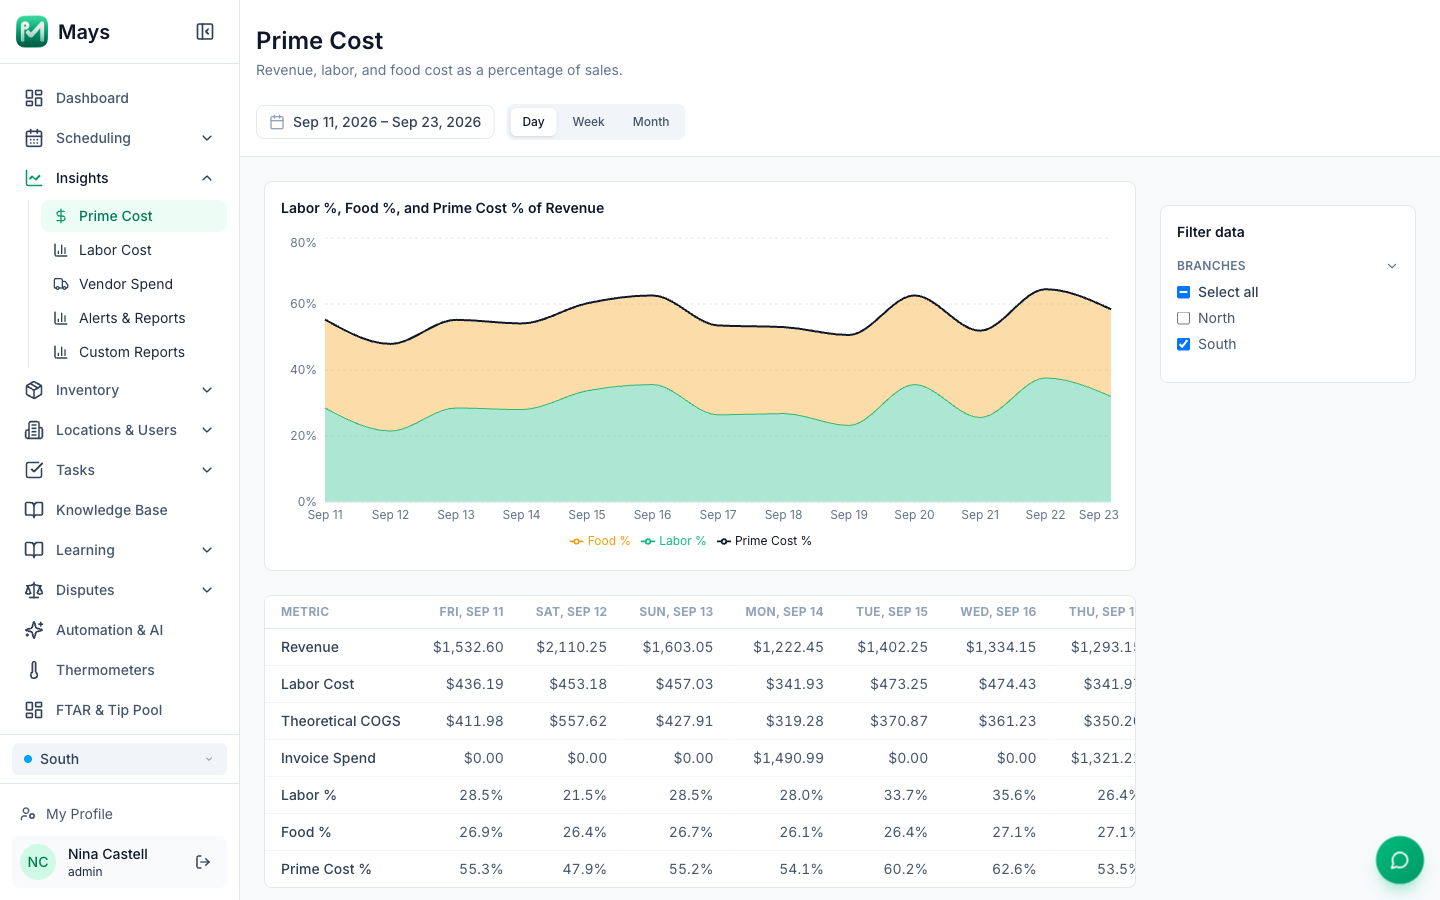
In the chart, Labor % (green) and Food % (amber) are stacked, so the top of the amber band is your prime cost. The black line is Prime Cost %. Hover over a day to see its numbers.
What each row means
Row | What it is |
|---|---|
Revenue | Net sales from your POS: what the items sold for after discounts, without tax, tips or service charges. Canceled and voided orders don't count. |
Labor Cost | Hours from finished time clock punches, times each person's hourly wage, plus overtime. People on a weekly salary add a seventh of their salary for every day. |
Theoretical COGS | The cost of goods your sales should have used: what your recipes say each sale takes, at each ingredient's cost. |
Invoice Spend | What your posted vendor invoices came to. It's there to compare with, and isn't part of any percentage. |
Labor % | Labor Cost ÷ Revenue. |
Food % | Theoretical COGS ÷ Revenue. |
Prime Cost % | (Labor Cost + Theoretical COGS) ÷ Revenue. |
Total, at the end of the table, covers the whole date range. A percentage shows — on a day with no sales.
Which wage: the one saved on the punch when it was made. If the punch has none, Mays uses the person's hourly wage, then their wage for that position, then the position's default wage. Overtime (weekly, daily, double time and 7th-day) is added on top, priced the same way as the pay summary: by your overtime settings in Scheduling → Settings and, with Labor law compliance's Overtime law on at a location, by the law at its address where it's more protective (see Labor & compliance). Payroll taxes and benefits aren't included.
Costs by category
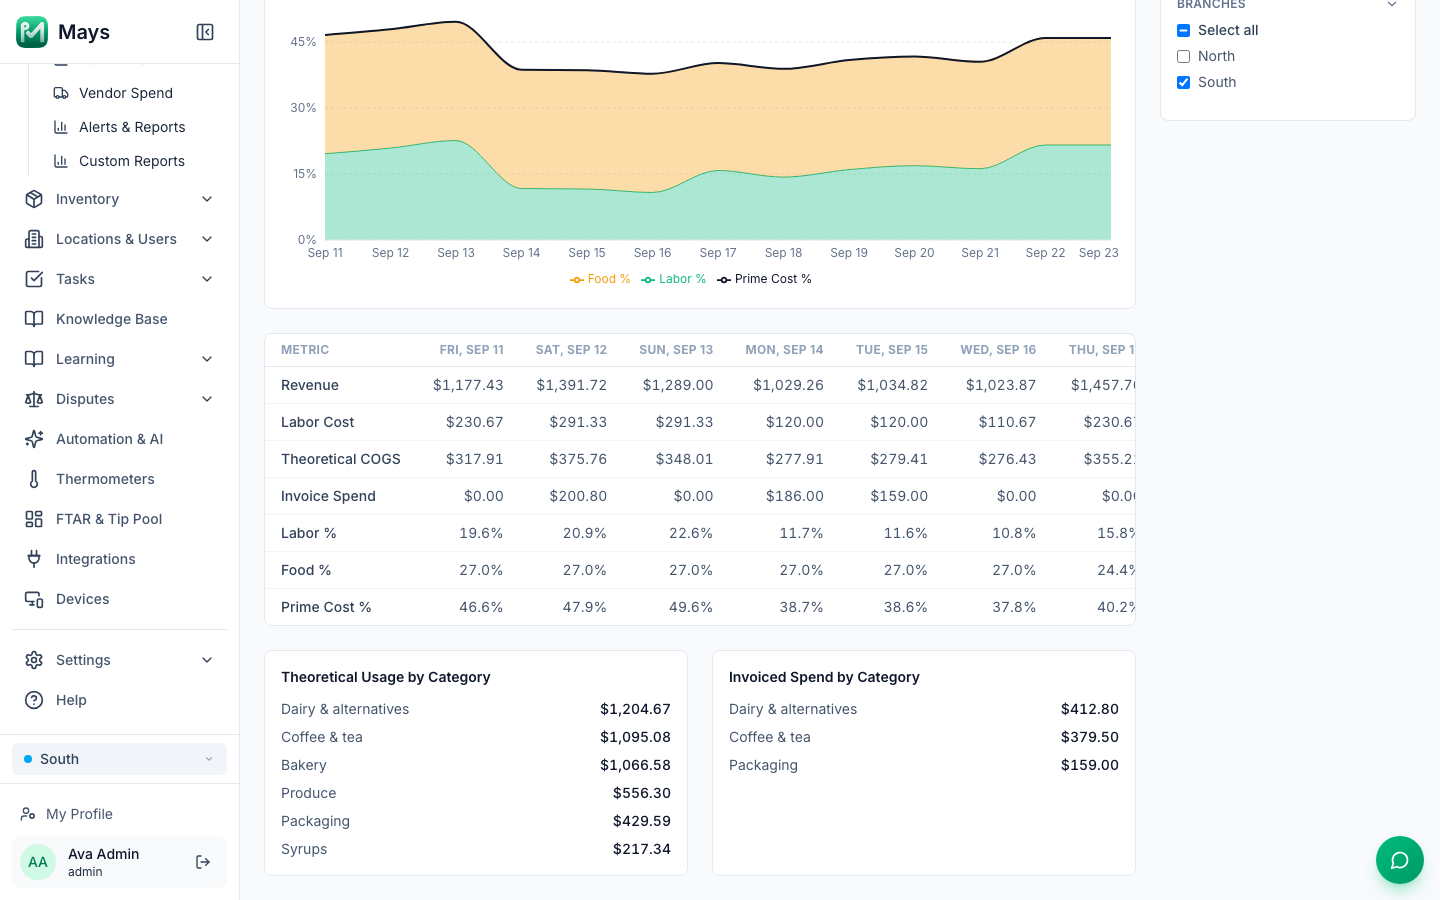
Below the table, two cards split the costs by the category of each inventory item:
- Theoretical Usage by Category: the Theoretical COGS.
- Invoiced Spend by Category: the Invoice Spend. Invoice lines that aren't matched to an item are Uncategorized.
Good to know
- Food cost is theoretical. It comes from sales and recipes, not from stock counts, so waste and over-portioning don't show here. To see those, compare with counts on Theoretical vs actual usage.
- Only mapped sales count toward food cost. A menu item that isn't mapped to a recipe adds nothing. With no items mapped, Food % reads 0.0%.
- Food cost shows up the next morning. Mays works out what recipes used overnight, so today's Theoretical COGS, Food % and Prime Cost % stay low until then.
- Food % covers everything your recipes use, including drinks and packaging like cups and lids, divided by all your sales.
- Revenue can be higher than your POS's net sales. Refunds aren't taken off, and Square orders that are still open, such as unpaid online orders, are counted.
- Days are each location's own days, in its time zone. Weeks run Monday to Sunday.
- There's no export. To get these numbers by email each week or month, schedule a Prime Cost report. See Alerts and scheduled reports.
- The filters hide on narrow screens. If you don't see Filter data, make the window wider.
- The schedule's Labor % won't match. The Labor % on the schedule builder compares scheduled labor with Square payments, tax included. Insights uses hours actually worked and net sales from Square or Union.