Compare what your sales say you should have used with what you actually used. The Theoretical page shows each ingredient's deliveries, waste, transfers and recipe use.
- Theoretical usage is what your recipes say your sales used. It comes from POS mapping. See POS mapping and automatic depletion.
- Actual usage is what left your shelves: start inventory + deliveries − transfers − end inventory.
- Variance is actual − theoretical. Above zero means you used more than the recipes predict: waste, over-portioning, spills or theft.
Before you rely on it: counts can't be approved yet
The start and end inventory come from approved counts, and counts can't be approved from the web or the apps yet. Until they can:
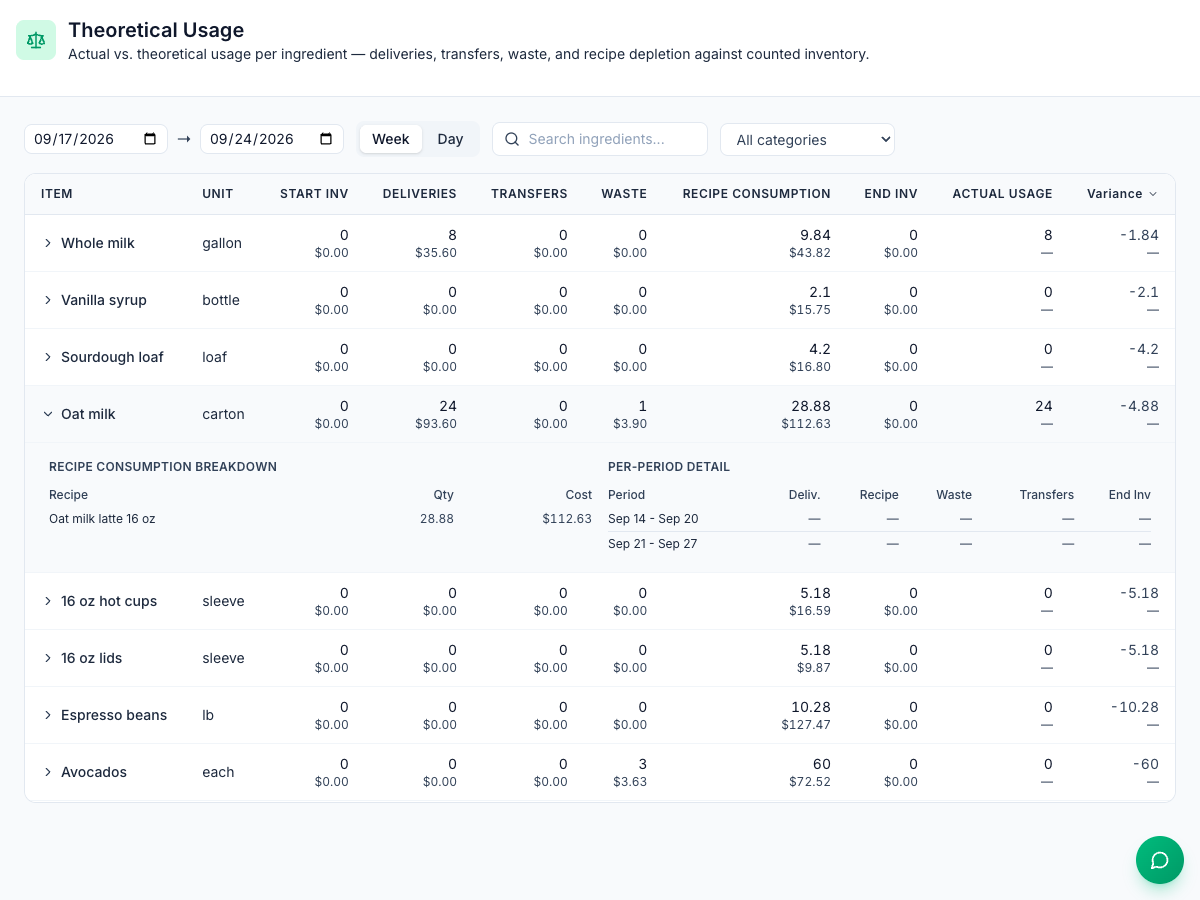
- Start Inv and End Inv show 0 for every item (Not yet counted);
- Actual Usage only adds up deliveries and transfers, and Variance shows minus the recipe use, so neither means anything yet;
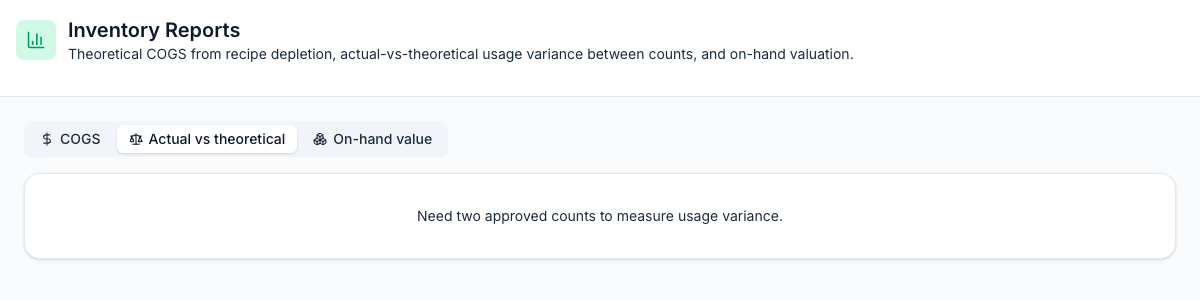
- Inventory → Reports → Actual vs theoretical shows Need two approved counts to measure usage variance.
Deliveries, Waste, Transfers and Recipe Consumption are right today. For actual usage, use your own counts: take the opening count from one submitted count, add the deliveries shown here, and subtract the closing count. See Running stock counts.
Open the Theoretical page
- Go to Inventory → Theoretical (under Analysis).
- Pick the dates. The page starts on the last 30 days.
- Choose Week or Day for the breakdown, and narrow it with Search ingredients or a category.
- Click Variance in the header to sort by it.
- Click an ingredient to open its details.
The columns
Column | What it is |
|---|---|
Start Inv | The item's last approved count on or before the start date |
Deliveries | What posted invoices added, in count units |
Transfers | What was sent to another location. Stock received from another location shows as a minus number. See Transfers between locations |
Waste | What was logged as waste, on the web or with a waste form |
Recipe Consumption | What sales used, from mapped recipes |
End Inv | The last approved count on or before the end date |
Actual Usage | Start Inv + Deliveries − Transfers − End Inv |
Variance | Actual Usage − Recipe Consumption. Red when more than 10% over; green when under |
Each number has its cost under it. Waste isn't taken out of actual usage, so it's part of the variance.
In an ingredient's details:
- Recipe consumption breakdown lists which recipes used it, with amounts and costs.
- Per-period detail has a row per week or day, but its numbers show — for now.
A unit mismatch tag means deliveries came in a pack Mays couldn't match to the item's units, so they may not compare directly. Check the item's units. See Inventory items.
Inventory reports
Inventory → Reports has three tabs:
- COGS: theoretical cost of goods from recipe use, your net sales, and COGS %, for the dates you pick. To see it next to labor, day by day, use Prime cost.
- Actual vs theoretical: needs two approved counts (see above).
- On-hand value: what your stock on hand is worth, item by item, and roughly how many days it will last at the last 30 days' usage.
Good to know
- Only mapped sales count. A menu item that isn't mapped to a recipe adds nothing to theoretical usage.
- Sales made before a count still count as usage here, but they aren't taken out of stock again after the count. See POS mapping and automatic depletion.
- Dates follow the location's time zone, so late-evening sales, waste, deliveries and counts land on the day they happened.
- Weeks run Monday to Sunday. A week can start before or end after the dates you picked.
- The page shows up to 500 ingredients.