Three reports for a location: theoretical COGS against your sales, what your stock is worth and how many days it lasts, and actual vs theoretical usage.
Who: admins, and managers at their own locations, on the web.
- Pick the location in the sidebar.
- Go to Inventory → Reports (the page is Inventory Reports).
- Pick a report with the tabs at the top: COGS, Actual vs theoretical or On-hand value.
- For COGS, set the two dates. They start at the last 30 days.
COGS
What your recipes say the food you sold cost, against what you sold:
- Theoretical COGS: the cost of the ingredients your mapped recipes took out of stock for the sales between the two dates.
- Net sales: your POS net sales for those dates, leaving out cancelled orders.
- COGS %: COGS divided by net sales. It's red above 32%.
The table lists each item's Used amount and its Cost, biggest cost first.
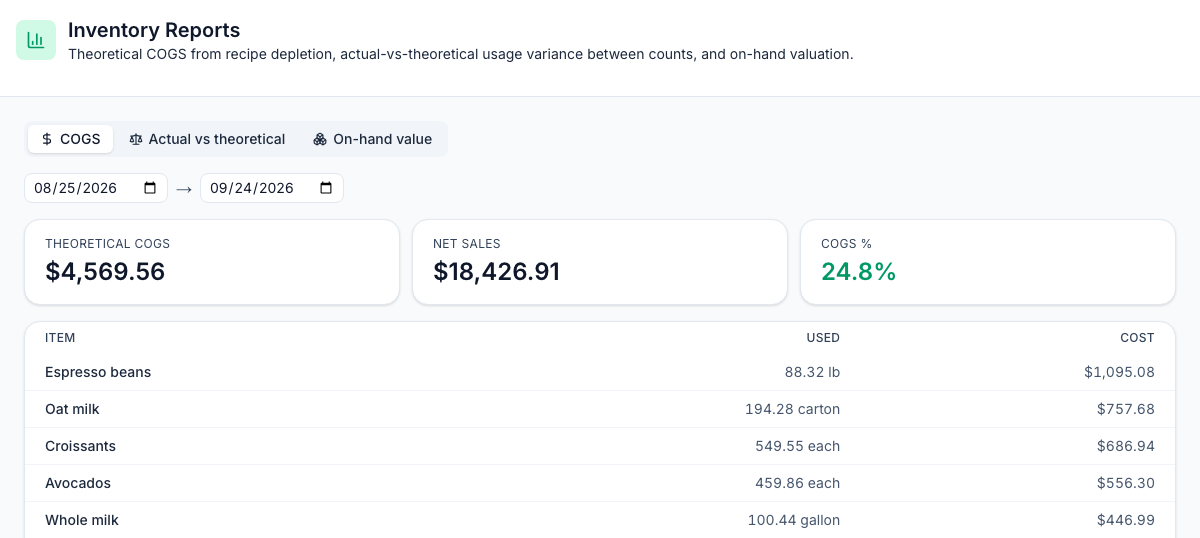
It needs your POS items mapped to recipes. With nothing mapped it says No depletion in this range — map POS items and run depletion. See POS mapping and automatic depletion. If you brought in usage from Craftable, that counts too. See Importing from Craftable.
What's not in it: waste and transfers. COGS assumes every plate was made exactly to its recipe; what really left the shelves shows up only when you compare with your counts.
On-hand value
What the location's stock is worth now:
- Inventory on hand: the total value.
- SKUs in stock: how many items have stock at this location, including any at zero or below.
For each item: On hand, Unit cost, Value (on hand × unit cost) and Days left: on hand divided by the average a day your sales used over the last 30 days. Items your sales don't use show —.
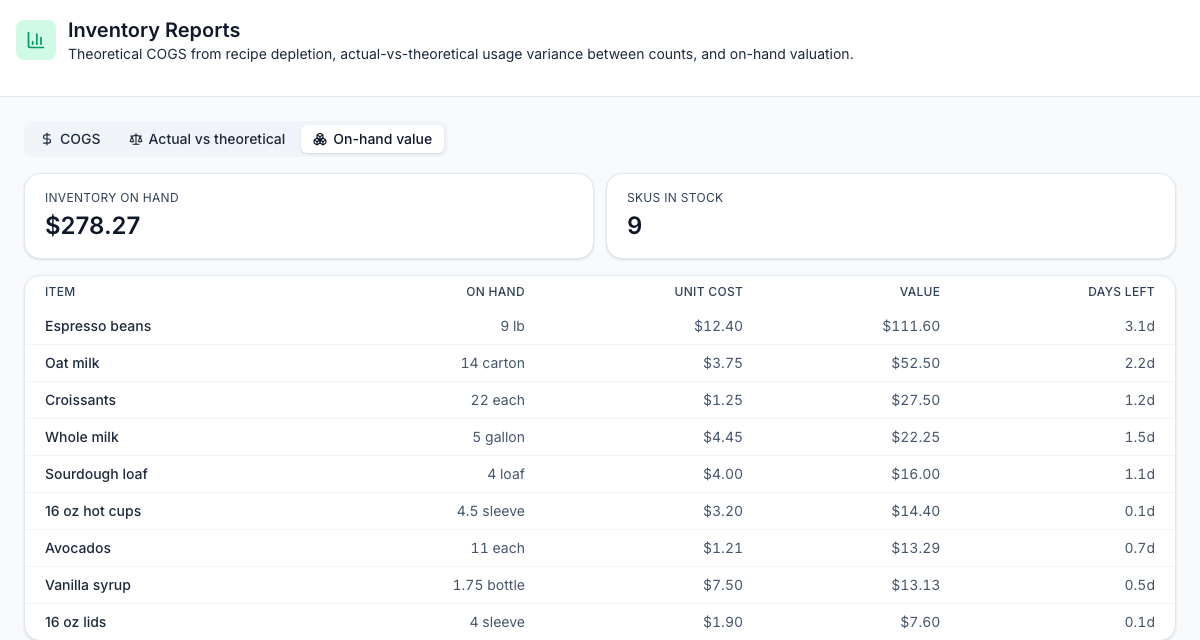
Unit cost here is the lowest current price any vendor charges for the item, per count unit, whichever location the price is for. It can be lower than the cost your recipes use, which takes this location's own price first, and an item with only an imported cost and no vendor price shows $0.00.
Actual vs theoretical
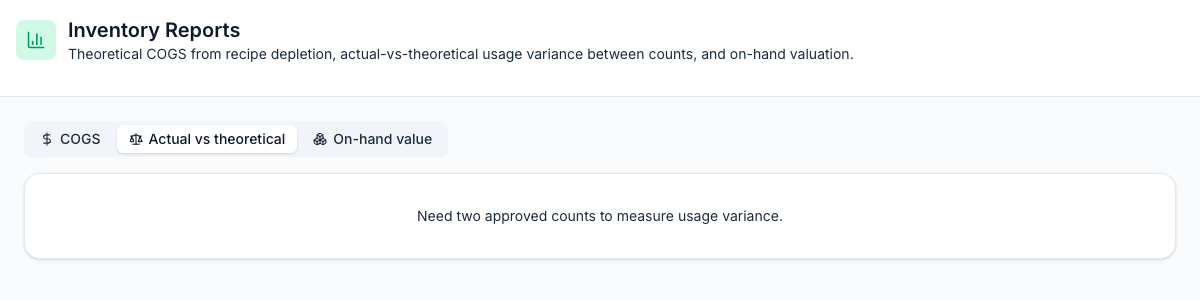
This report compares what you actually used between your two most recent approved counts with what your recipes say you used. Counts can't be approved yet, so it shows Need two approved counts to measure usage variance. To compare by hand, see Theoretical vs actual usage.
Good to know
- Dates follow the location's time zone, so late-evening sales count on the day they were made.
- Costs are set when sales are processed each night, at that day's prices. Changing a recipe changes the last three days, which are processed again each night.
- For food and labor cost together, see Prime cost.
- The reports show one location at a time, and there's no export.