Prime cost for a new restaurant: what it is and how to track it every week
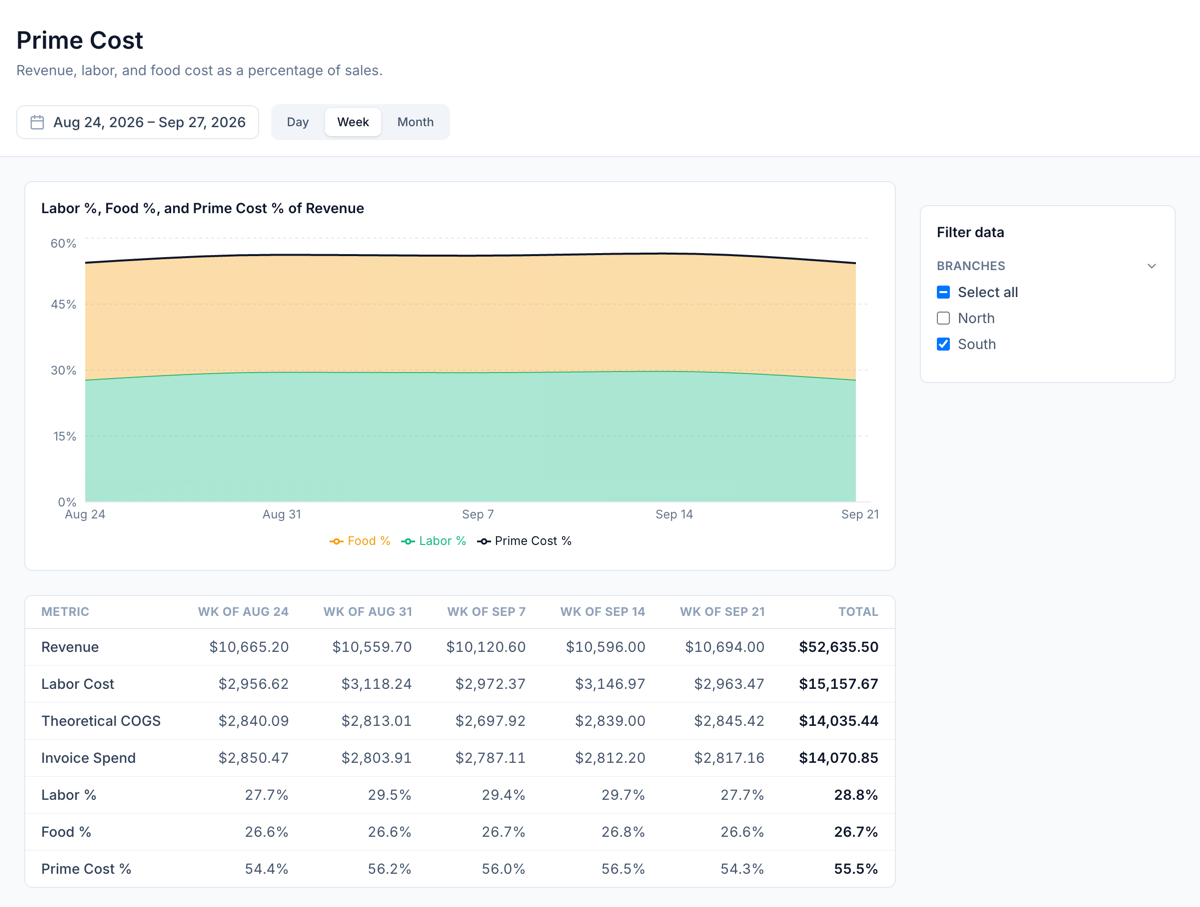
In your first months, money goes out in a dozen directions: rent, the produce delivery, payroll, the espresso machine repair. Two of those directions are much bigger than the rest and change every week: what you spend on food and drink, and what you spend on people. Together, they're called prime cost.
This is the first post in our series on running the numbers in your first year. It covers what prime cost includes, how to calculate it for a week, and a short routine to check it every Monday, so a bad week shows up while you can still do something about it.
Every business number in this post is made up to show the math. Tax figures link to the IRS and other official sources. This is general information, not financial or tax advice.
What prime cost is
Prime cost = cost of goods sold + total labor cost
As a percentage, divide it by sales for the same period:
Prime cost % = prime cost ÷ sales
It's the number that tells you, more than any other, whether the business works. Rent and most other costs are fixed by contracts; prime cost is the part you control every day, with every order you place and every shift you schedule.
The first half: cost of goods sold
Cost of goods sold (COGS) is what you used of the food, drink and other things you sell. The IRS works it out once a year for your taxes, starting from the inventory you had, adding what you bought and subtracting what's left; in its words, "you must value your inventory at the beginning and end of each tax year" (IRS Publication 334, chapter 6). For a weekly check, the same idea in a simpler form:
COGS = opening inventory + purchases − closing inventory
A few rules make it useful:
- Count on the same day, at the same time, every week, with the same items and units. Closing inventory this Sunday night is next week's opening inventory.
- Count purchases by delivery date, not by when the invoice gets paid. A Monday delivery belongs to the week it arrived.
- Decide what's in and keep it that way. Most operators count food and drinks; some add packaging, like cups and lids. Either is fine as long as you're consistent, so this week compares with last week.
- Leave out what you don't sell: cleaning supplies, smallwares, the new blender.
If you're not counting yet, our guide to café inventory from day one covers counts and par levels. Food cost per plate, the "should cost" side, is in food cost for a small restaurant.
The second half: total labor cost
Labor cost is more than the hourly wages on the timesheet. For prime cost, include:
- Hourly wages, overtime included
- Salaries, such as a general manager or kitchen manager, for the share of the year that falls in the week
- Employer payroll taxes. The employer pays its own share of Social Security and Medicare on top of the employee's: "The rate of social security tax on taxable wages is 6.2% each for the employer and employee," and "The Medicare tax rate is 1.45% each for the employee and employer" (IRS Publication 15). There's also federal unemployment tax (FUTA), 6.0% on the first $7,000 of each employee's wages, usually reduced to 0.6% by a credit for state unemployment tax (IRS Topic 759), and your state's unemployment tax.
- Benefits you pay for: health insurance, paid time off, meals if you track them, workers' compensation insurance
Benefits and taxes add up. In the Bureau of Labor Statistics' count for June 2026, wages and salaries were 80.8% of what employers in accommodation and food services spent on compensation; the rest was benefits, including paid leave and legally required benefits like Social Security (BLS, Employer Costs for Employee Compensation, table 4). If you look only at wages, your labor cost will look lower than it is.
Your own pay: if you work in the business and pay yourself, decide whether it goes in labor and keep that rule. If you work shifts that you'd otherwise pay someone for, leaving your hours out makes your prime cost look better than the business really is.
A worked week
A hypothetical café, with round numbers, for one week:
Line | Amount |
|---|---|
Sales (net of discounts, without sales tax or tips) | $10,000 |
Opening inventory (last Sunday's count) | $2,000 |
Purchases delivered this week | $3,200 |
Closing inventory (this Sunday's count) | $2,100 |
Cost of goods sold ($2,000 + $3,200 − $2,100) | $3,100 |
Hourly wages, overtime included | $2,000 |
Manager's salary for the week | $900 |
Employer payroll taxes (estimated) | $250 |
Benefits | $50 |
Total labor cost | $3,200 |
Prime cost ($3,100 + $3,200) | $6,300 |
Prime cost % ($6,300 ÷ $10,000) | 63% |
Now the following week:
Week 1 | Week 2 | |
|---|---|---|
Sales | $10,000 | $9,000 |
COGS | $3,100 (31%) | $3,150 (35%) |
Labor | $3,200 (32%) | $3,250 (36.1%) |
Prime cost % | 63% | 71.1% |
Sales fell 10%, but both costs went up in dollars. Labor didn't shrink because the schedule wasn't trimmed for a quieter week. Food went up because more was used, or wasted, on fewer sales. Each half points to its own questions, below.
What's a good prime cost?
There's no official target, and the right number depends on your concept, your prices and your rent. Two points of reference:
- What restaurants reported. In the National Restaurant Association's 2025 Restaurant Operations Data Abstract, "Prime costs including food, beverage, and labor were a median of 65 cents of every sales dollar in the limited-service segment" (National Restaurant Association, August 20, 2025). That's a median of what operators reported, not a goal.
- A rule of thumb. Many operators aim to keep prime cost somewhere around 60% to 65% of sales or lower. It isn't an official benchmark; use it as a starting point, then set your own target from your break-even math.
What matters more than any benchmark is your own trend, week after week, and how far you are from your own target.
A 20-minute Monday routine
- Close last week. Make sure Sunday's count is done and every delivery is entered.
- Fill in the five numbers: sales, opening inventory, purchases, closing inventory and labor (from your payroll or time clock, plus a fixed estimate for taxes and benefits).
- Write the three percentages: COGS %, labor % and prime cost %, next to the last four weeks.
- If it's up, find which half. Then ask the half's questions:
- Food up? A vendor price change, a short delivery, waste, over-portioning, comps, a count mistake. Compare invoices with last week's prices; look at the waste log.
- Labor up? More hours than scheduled, overtime, early clock-ins, a schedule that didn't follow a drop in sales. Compare scheduled hours with worked hours.
- Pick one action for this week, not five. Write it down, and check it next Monday.
A spreadsheet with one row per week is enough. The habit matters more than the tool.
Common mistakes
- Using purchases as COGS without counting inventory (a big order makes one week look terrible and the next look great)
- Counting on different days, or skipping counts when it's busy
- Leaving payroll taxes, benefits or salaried managers out of labor
- Looking at prime cost once a month, when it's too late to fix the weeks behind it
- Comparing your number with someone else's instead of your own last eight weeks
Where Mays fits
Mays puts the pieces of prime cost in one place, from the same app your team uses to clock in and run checklists:
- Prime Cost (Insights → Prime Cost, the image at the top of this post, for admins): Revenue from Square or Union POS, Labor Cost from finished time clock punches and wages, and Theoretical COGS from recipes and mapped sales, with Labor %, Food % and Prime Cost % by day, week or month, per location or across several.
- Invoice Spend sits next to it on the same table, from the vendor invoices you post under Inventory → Invoices, so you can see what you bought alongside what your sales say you used.
- A weekly email: schedule a Prime Cost report under Insights → Alerts & Reports, for the locations you pick. Weekly reports arrive on Monday morning with the previous Monday-to-Sunday week, which is your Monday routine's starting point.
- Vendor Spend (Insights → Vendor Spend) and a Vendor Price Change alert show which items got more expensive, and Labor Cost (Insights → Labor Cost) compares scheduled with worked hours.
Two things to know so the numbers match your spreadsheet:
- Mays's food cost is theoretical. It's what your recipes say your sales used, so waste, over-portioning and theft don't show up in it. Keep counting stock and do the opening + purchases − closing math for your actual COGS, then compare the two: the gap is what went missing.
- Mays's labor cost is wages only. It's hours worked times each person's wage, overtime included, plus salaried staff, but payroll taxes and benefits aren't included. Add your estimate for those, as in the worked example.
Your prime cost checklist
- A fixed weekly count day and time
- Purchases recorded by delivery date
- One written rule for what's in COGS and what's in labor
- Payroll taxes, benefits and salaries included in labor
- One row per week: sales, COGS, labor, and the three percentages
- Your own prime cost target, and an eight-week trend
- One action a week when it's off
Track prime cost in Mays
See labor, food cost and sales side by side, and get the week's numbers in your inbox every Monday.
Start your free trial: 30 days, every module, no card needed. Next in this series: the break-even point for a small café.