Forecasting weekly sales from your POS history, so you can staff to it
Every schedule is a guess about next week. If you staff Friday for a rush that doesn't come, you pay people to wait; if you staff it light and the rush comes, the line goes out the door and the reviews follow. A sales forecast makes that guess on purpose, from your own numbers, before you build the schedule.
This is the third post in our series on running the numbers in your first year. It shows a simple forecast you can do from your point-of-sale (POS) reports in a few minutes a week, how to turn it into staffing by the hour, and how to tell whether it's getting better. The break-even post explains what the sales have to cover.
Every number in this post is made up to show the method. Use your own POS history.
What you need from your POS
Most POS systems can export sales by day and by hour. You need:
- Net sales by day, after discounts, without sales tax and tips, for as many recent weeks as you have
- Net sales by hour, for the same weeks
- Transactions (ticket count) and the average ticket, if your POS shows them
Keep a note of anything unusual next to the day it happened: a catering order, a storm, a street fair, a day you closed early. Those notes matter more than they seem; they're how you'll know which days to leave out.
Step 1: Line up the same weekday
Sales follow the week. Monday isn't Friday, so compare each day with the same weekday in past weeks, not with yesterday.
Here are a hypothetical café's last four Fridays, newest first:
Friday | Net sales | Notes |
|---|---|---|
Last week | $2,000 | |
2 weeks ago | $1,900 | |
3 weeks ago | $1,800 | |
4 weeks ago | $1,700 |
Step 2: Weight the recent weeks more
The simple average is $1,850. But sales have been climbing every week, and a plain average lags behind that. Give recent weeks more say. With weights of 4, 3, 2 and 1:
Friday | Sales | Weight | Sales × weight |
|---|---|---|---|
Last week | $2,000 | 4 | $8,000 |
2 weeks ago | $1,900 | 3 | $5,700 |
3 weeks ago | $1,800 | 2 | $3,600 |
4 weeks ago | $1,700 | 1 | $1,700 |
Total | 10 | $19,000 |
Weighted average = $19,000 ÷ 10 = $1,900
That's next Friday's starting point. Do the same for each day of the week, and add them up for the week's forecast.
Leave out days that don't represent a normal week. If one Friday had a $600 catering order, take the order out before you average, or skip that Friday. If the café closed early for a storm, skip the day.
Step 3: Adjust for what you know
The history can't know what's coming. You do. Before you lock the forecast, go through next week day by day:
Question | Example adjustment |
|---|---|
Is there a holiday? | A café near offices may be quiet on a Monday holiday; one near a beach may be busier |
Is there a local event? | A festival two blocks away on Saturday |
Is the weather unusual? | A heavy rain forecast for a café with walk-in traffic |
Did something change? | A new menu item, a price increase, new hours, roadwork out front |
Is a season turning? | School starting or ending, tourists arriving or leaving |
Make the change in dollars and write down why: "+$200, street fair." Next week you'll be able to check whether the adjustment was right, which is how you learn how much a street fair is worth to you.
Changes like a season turning need a few weeks before a weighted average catches up. Our posts on back-to-school scheduling and planning labor for a slow season cover those stretches.
Step 4: Split the day by hour
A daily number tells you how many hours to schedule; the hourly split tells you when. From your POS's sales-by-hour report, work out what share of the day each block of hours usually brings in. For the hypothetical Friday at $1,900:
Hours | Usual share of the day | Forecast sales |
|---|---|---|
7–10 am | 40% | $760 |
10 am–1 pm | 35% | $665 |
1–4 pm | 25% | $475 |
Then turn each block into staff hours with a productivity target, such as sales per labor hour. Our slow-season post walks through that math; the next post in this series shows how to set a weekly labor budget from the forecast and review it every week.
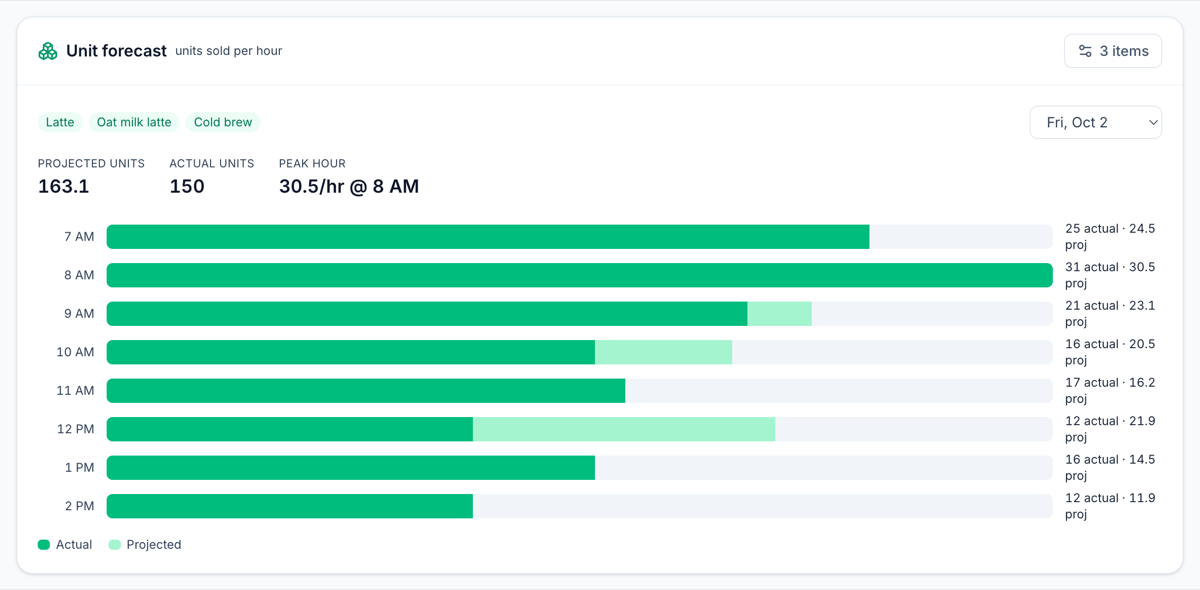
If you sell a lot of one kind of item, like coffee drinks or smoothies, forecast units per hour too. The number of drinks at 8 am says more about how many people you need on the bar than the dollars do.
Step 5: Your first weeks, with no history
A brand-new café has no Fridays to average. For the first weeks:
- Start from your opening plan. Expected transactions per day × your expected average ticket.
- Check it against capacity. How many drinks can one bar make in an hour? How many seats turn at lunch? The forecast can't be bigger than what you can serve.
- Staff a little heavy in week one, on purpose. New teams are slower, and first impressions count.
- Use each week's actual sales as soon as you have them. After two or three weeks, switch to the weighted average, and after eight, you'll have a real pattern.
Step 6: Check how close you got
A forecast you never check never gets better. Each Monday, compare last week's forecast with actual sales:
Forecast error = (actual − forecast) ÷ forecast
Day | Forecast | Actual | Error |
|---|---|---|---|
Monday | $1,000 | $950 | −5% |
Friday | $1,900 | $2,090 | +10% |
Saturday | $2,400 | $1,920 | −20% |
Look for two things:
- A pattern. If you're under on Fridays every week, your Friday weighting is too slow; give the last week more weight or adjust up.
- The big misses. A −20% Saturday has a story: rain, an event across town, a broken machine. Write it in your notes so next year's forecast knows.
There's no official standard for "accurate enough." Aim to get the misses smaller over time, and watch the days you staff most heavily.
Common mistakes
- Averaging all days together instead of the same weekday
- Using last week only, so one odd week drives the next schedule
- Leaving catering orders and closures in the history
- Adjusting for an event without writing down why, so you can't learn from it
- Forecasting once, before opening, and staffing the same way for months
- Building the schedule first and the forecast after
Where Mays fits
Mays builds the forecast for you from your POS, on the same screen as the schedule tools:
- Forecast (Scheduling → Forecast): with Square or Union POS connected, Mays projects each day's sales from the same weekday over the last 8 weeks, with recent weeks counting more. When you connect, it brings in the location's last 30 days of sales, so projections start from four weeks and fill out from there.
- Your adjustments: click a day's Projected sales, type your number, and the day is marked Edited for everyone at the location. Mays shows the weather next to each day, but doesn't change the numbers for weather or holidays, so those adjustments are yours to make.
- Actual vs projected: each past day shows Actual sales next to the projection, and Scheduling → Reports → Actuals lists projected and actual sales, actual labor and Labor % per day, with Export CSV, so you can work out the error.
- Units by the hour (the image at the top of this post): the Unit forecast card shows Projected units, Actual units and the Peak hour for the items you pick from your Square item library, with an hourly chart.
- Projected labor %: the forecast page shows the labor cost of the shifts on next week's schedule, drafts included, as a share of projected sales, while you're still building it.
Two things to know: the forecast needs POS history, so for a brand-new location with no sales in Mays yet, keep the first weeks in a spreadsheet; and Square and Union are the POS systems Mays connects to today.
Your forecasting checklist
- Daily and hourly net sales exported from your POS
- Notes on unusual days (catering, weather, events, closures)
- Same-weekday weighted average for each day of next week
- Adjustments for holidays, events, weather and changes, each with a reason
- An hourly split for the days you staff heavily
- Units per hour for your main drinks or items, if they drive staffing
- Forecast error checked every Monday, with patterns fixed
Forecast next week in Mays
Connect your POS and get next week's projection, day by day, before you build the schedule.
Start your free trial: 30 days, every module, no card needed. Next in this series: setting a labor budget from the forecast, and the weekly labor review.