Download a thermometer's temperature log as a PDF or CSV for any dates, with your license number, the safe range and a pass or fail on every row, ready to show an inspector.
Where: Thermometers on the web; click a thermometer's name. Who: admins, and managers for the thermometers at their locations. Plan: Pro.
Before your first export
Add your license number to the location: Locations & Users → Locations, open the location and fill in License / Permit #. It's printed at the top of every log. See Adding and editing locations.
The temperature history
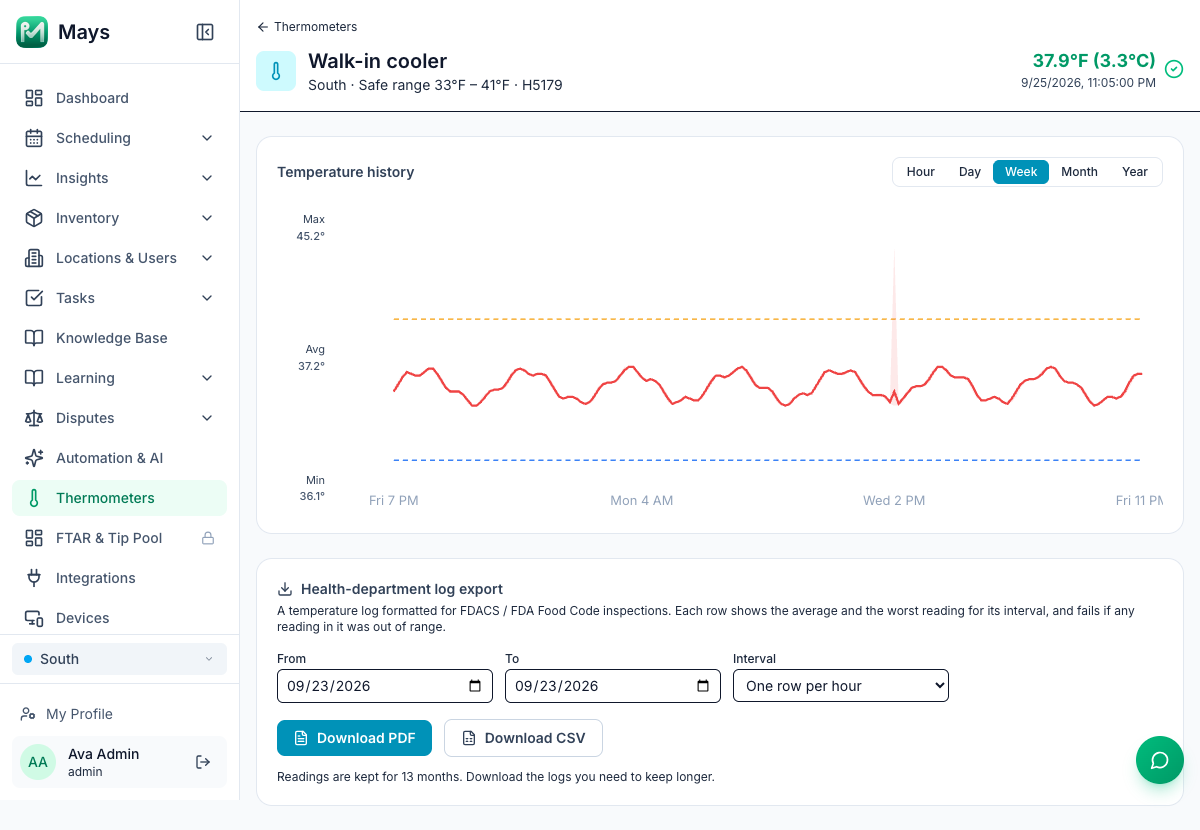
The top of the page shows the thermometer's location, safe range and latest reading. Under Temperature history, pick Hour, Day, Week, Month or Year:
- The line is the average temperature, and the shaded band around it the lowest to highest reading.
- The dashed lines are your range: orange for the maximum, blue for the minimum.
- Max, Avg and Min on the left are for the whole period shown.
A short spike on the chart is often the door being opened. A block that stays above the orange line is what the alerts are for, see Temperature thresholds and alerts.
Download the log
- Under Health-department log export, pick the From and To days. Both days are included, in the location's own time. The last seven days are filled in to start with.
- Pick the Interval:
- One row per hour — the average and the worst reading for each hour. A good everyday record.
- Every 4 hours — the average and the worst reading for each 4 hours, starting at 12 a.m., 4 a.m., 8 a.m. and so on in the location's time. The shortest log.
- Every reading (raw) — every reading, about one every five minutes.
- Click Download PDF or Download CSV.
What's in the log
At the top: Health Department Temperature Log, your Establishment name, the License/Permit #, the location (Branch), the thermometer (Device), the Date range, the Interval and the number of Excursions (rows marked Fail). Then one row per interval:
Column | What it shows |
|---|---|
Date, Time | In the location's time zone. |
Unit | The thermometer's name. |
Avg °F | The average of the readings in the row (the reading itself for Every reading). |
Worst °F | The reading closest to, or furthest past, a limit. On a Fail row it's the reading that failed it. |
Target | The safe range set on the thermometer. |
In range | Pass, or Fail if any reading in the row was outside the range. Fail rows are red in the PDF. |
Source | Govee sensor (auto). |
Corrective action | Always empty for now. Write corrective actions on the printed log, or keep the completed alert tasks as your record. |
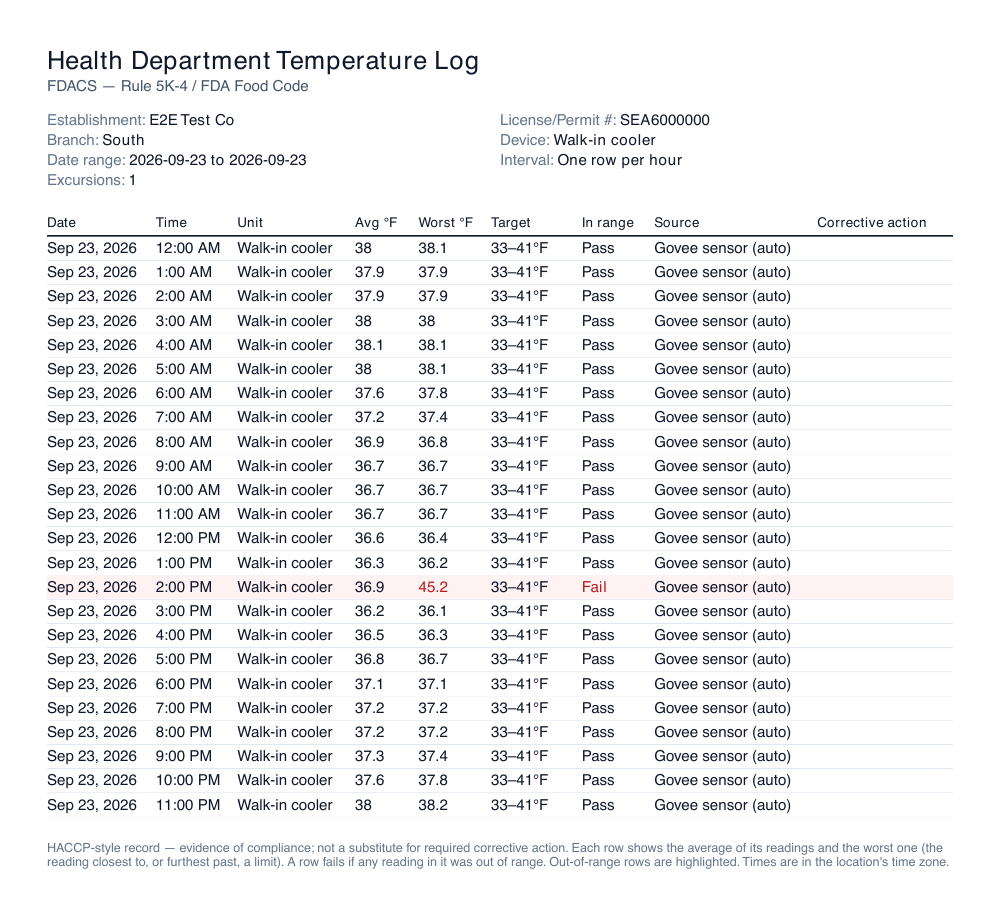
The CSV has the same header lines and columns, plus Readings (how many readings each row covers), and opens in Excel or Google Sheets.
One reading out of range fails the row
A row is Fail if any reading in it was outside the range, even when the average is fine. A cooler that reached 46°F for ten minutes fails that hour and its 4-hour row, and Worst °F shows the 46°F. Avg °F tells you whether it was a short spike or a whole hour out of range. To see exactly when it happened, export Every reading (raw) for that day.
Good to know
- The authority line under the title always reads FDACS — Rule 5K-4 / FDA Food Code. FDACS inspects grocery and retail food stores in Florida; restaurants and cafés are inspected by DBPR under the FDA Food Code. Check with your inspector which record they want.
- One thermometer per file. Download each unit's log separately.
- Every 4 hours rows follow the location's clock: 12 a.m., 4 a.m., 8 a.m., 12 p.m., 4 p.m. and 8 p.m., all year. On the night the clocks go back, the 12–4 a.m. row covers five hours, and in One row per hour the 1 a.m. hour appears twice.
- Readings are kept for 13 months. Download the logs you need to keep longer.
- Only sensor readings are in this log. Probe checks your team records on a checklist or custom form are in Tasks → Data, see Exporting task data.
- Disconnecting Govee keeps this history. You can still view and download it. New readings stop until you connect Govee again.